

build → deploy → live) and lists the public URLs once they’re up. Below that, the Logs and Shell tabs let you watch and debug — with Metrics, Timeline, and Volumes alongside for resource usage, state history, and snapshots.
Logs
Every line your containers write to stdout/stderr is captured and kept for 30 days. Slipway narrates its own deploy steps into the same stream, so the log tells the whole story — not just your app’s output.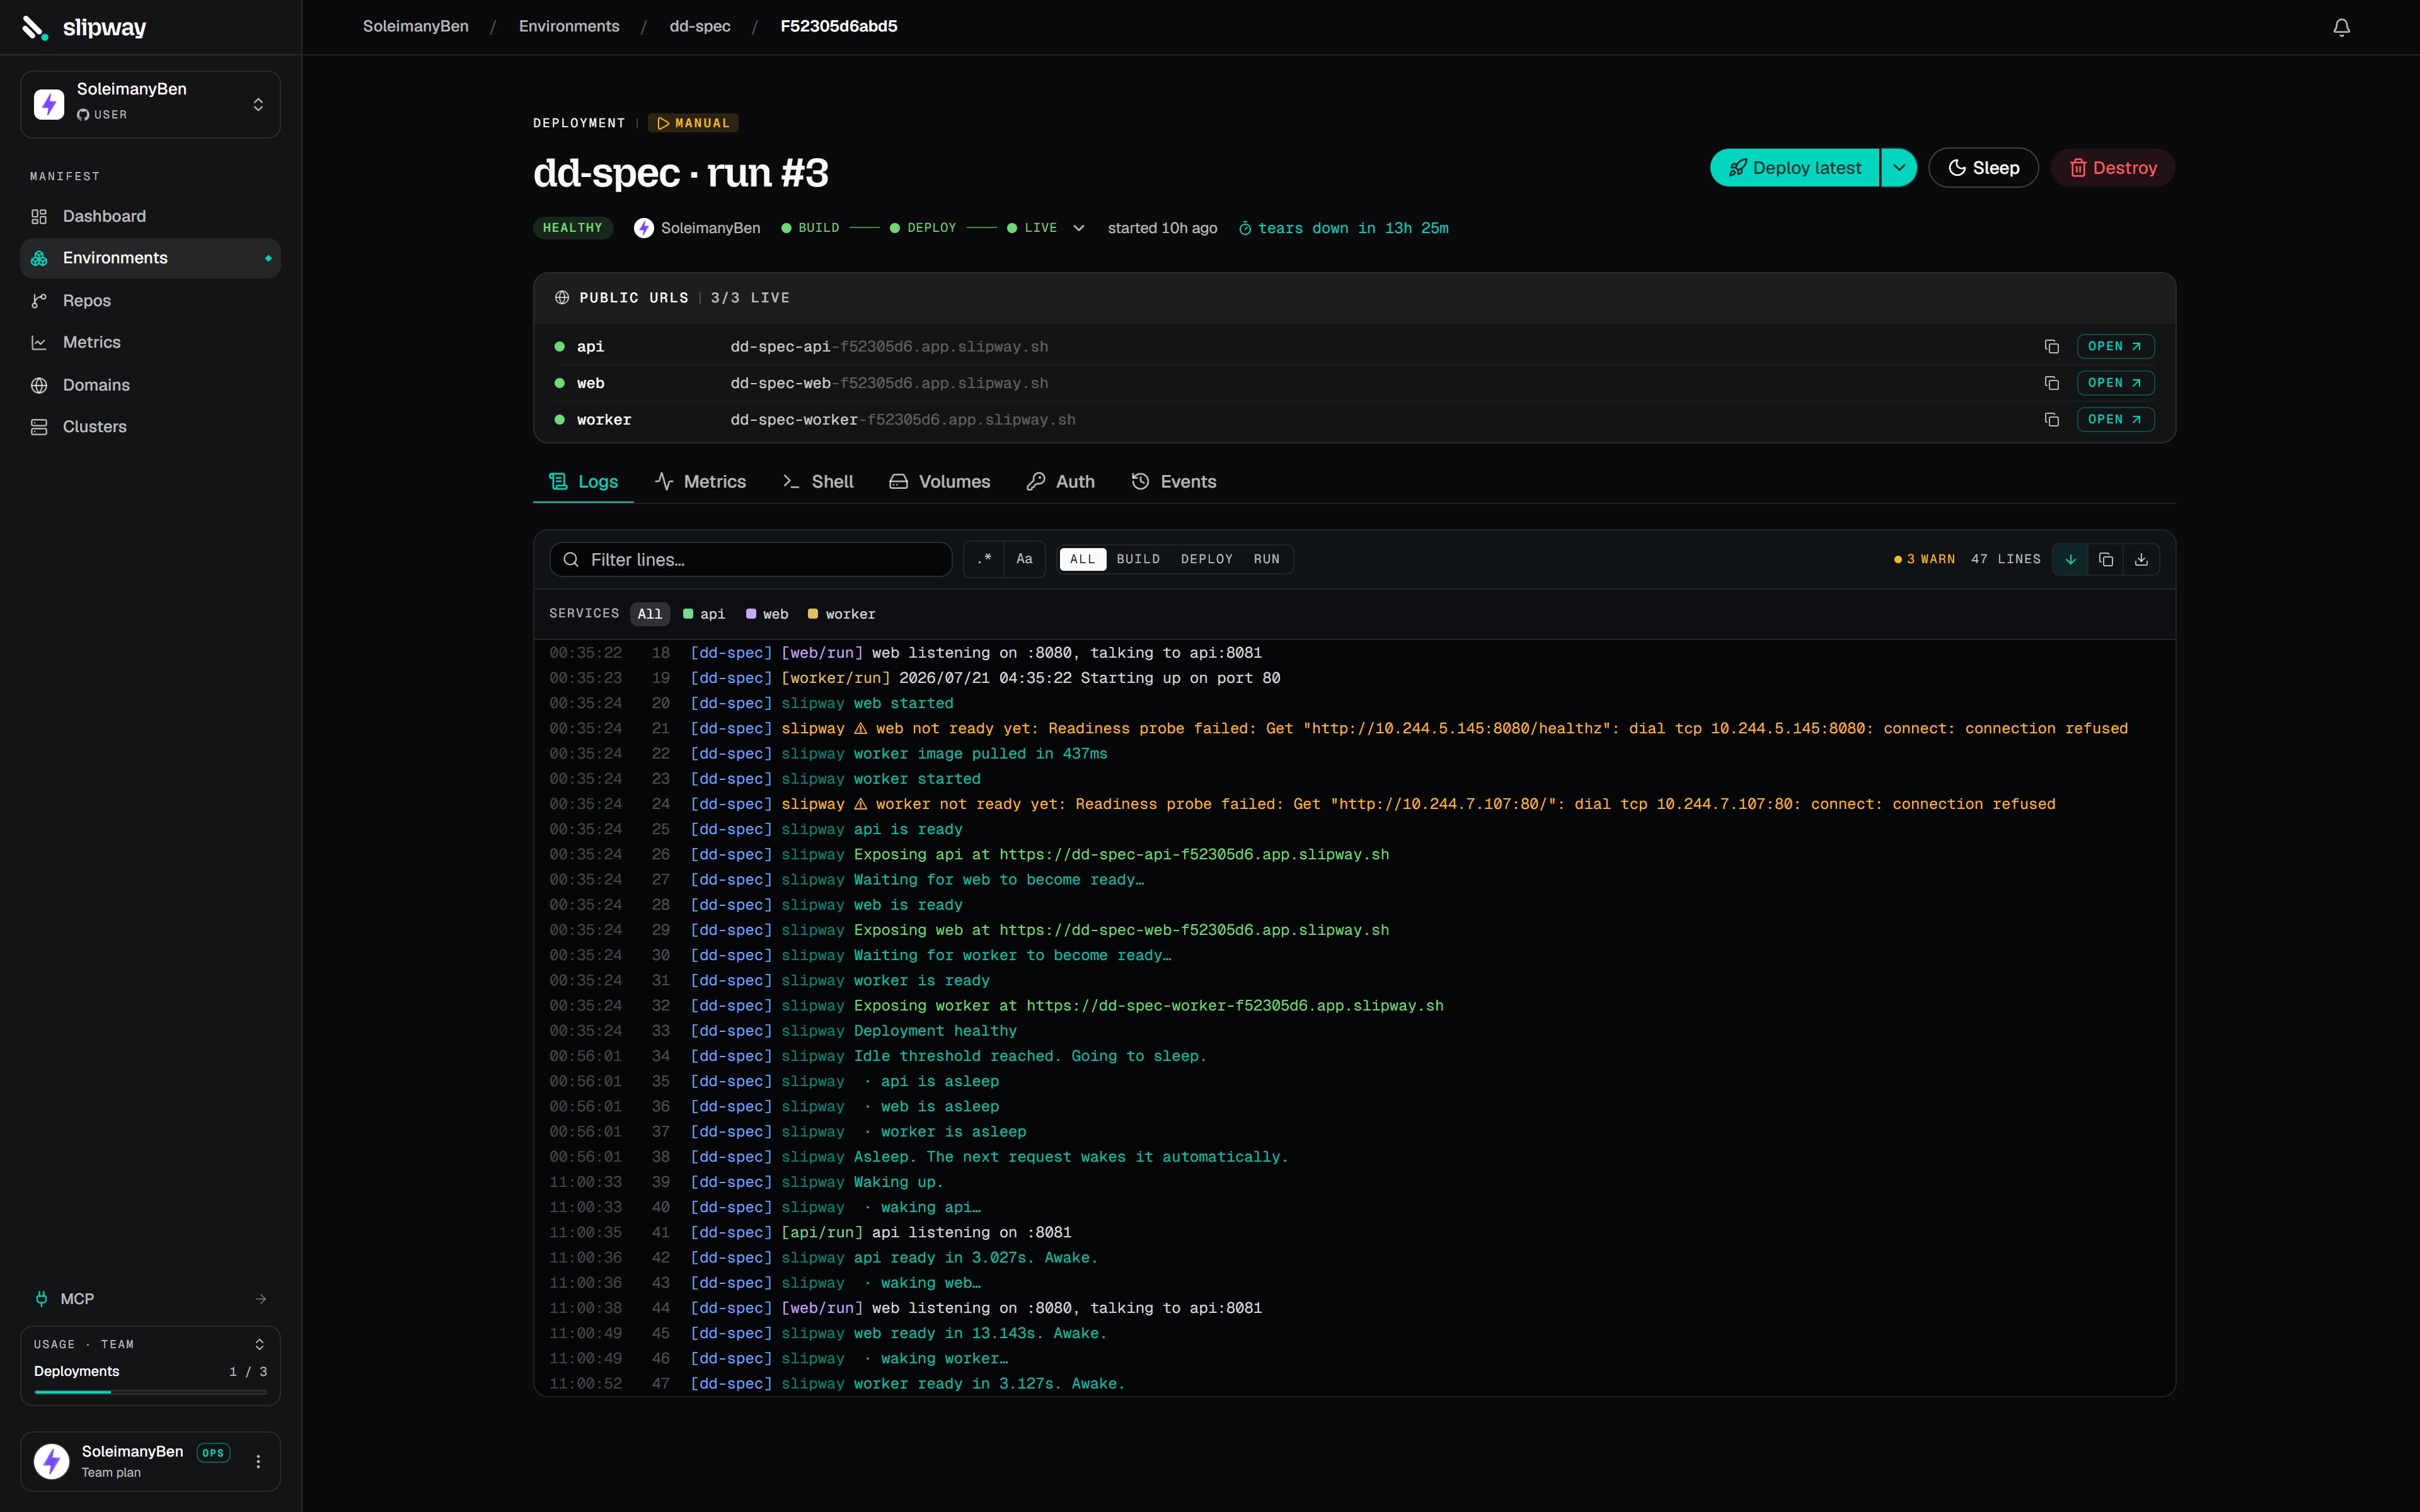
The Logs tab. Slipway's step narration is interleaved with build and container output.
- Slipway steps — the platform’s narration: fetching the spec, resolving secrets, building, deploying, waiting for readiness, and the final verdict.
- Build output — clone and image-build output, tagged by service.
- Container output — your services’ stdout/stderr once running, tagged by service.
- Build — image builds: clone and buildctl output plus the
Building…/Built…narration. - Deploy — slipway bringing the workload up: resolving secrets, applying workloads, preparing volumes, waiting for readiness, and exposing URLs, along with the surfaced pod events (scheduling, pulling, probes).
- Run — your services’ own stdout/stderr once they’re running.
.log file. Open the tab mid-deploy and you get the last few minutes immediately. For the full catalog of lifecycle statuses and event kinds, see Statuses & events.
Timeline
The Timeline tab draws every state the deployment’s services have been in on one horizontal time axis, like a video editor’s timeline — one row per service, grouped by repo, with an environment-level band on top. Colored spans show queued, building (per service, with cache hits visible), deploying, healthy, sleeping and waking cycles, and any crashed or down stretches; markers flag failures, cancellations, cutover, and teardown. Hover any span for its duration, the commit and trigger behind it, and why it ended. Scroll to zoom, drag to pan, double-click to reset, and switch the range between the last hour, day, week, or the whole life of the instance. Unlike logs and metrics, the timeline is built from durable deploy records, so it keeps the full history — a crash loop from two months ago is still there.Shell
When a deployment is healthy, open the Shell tab to get an interactive shell straight into any of its containers — nokubectl, no kubeconfig.
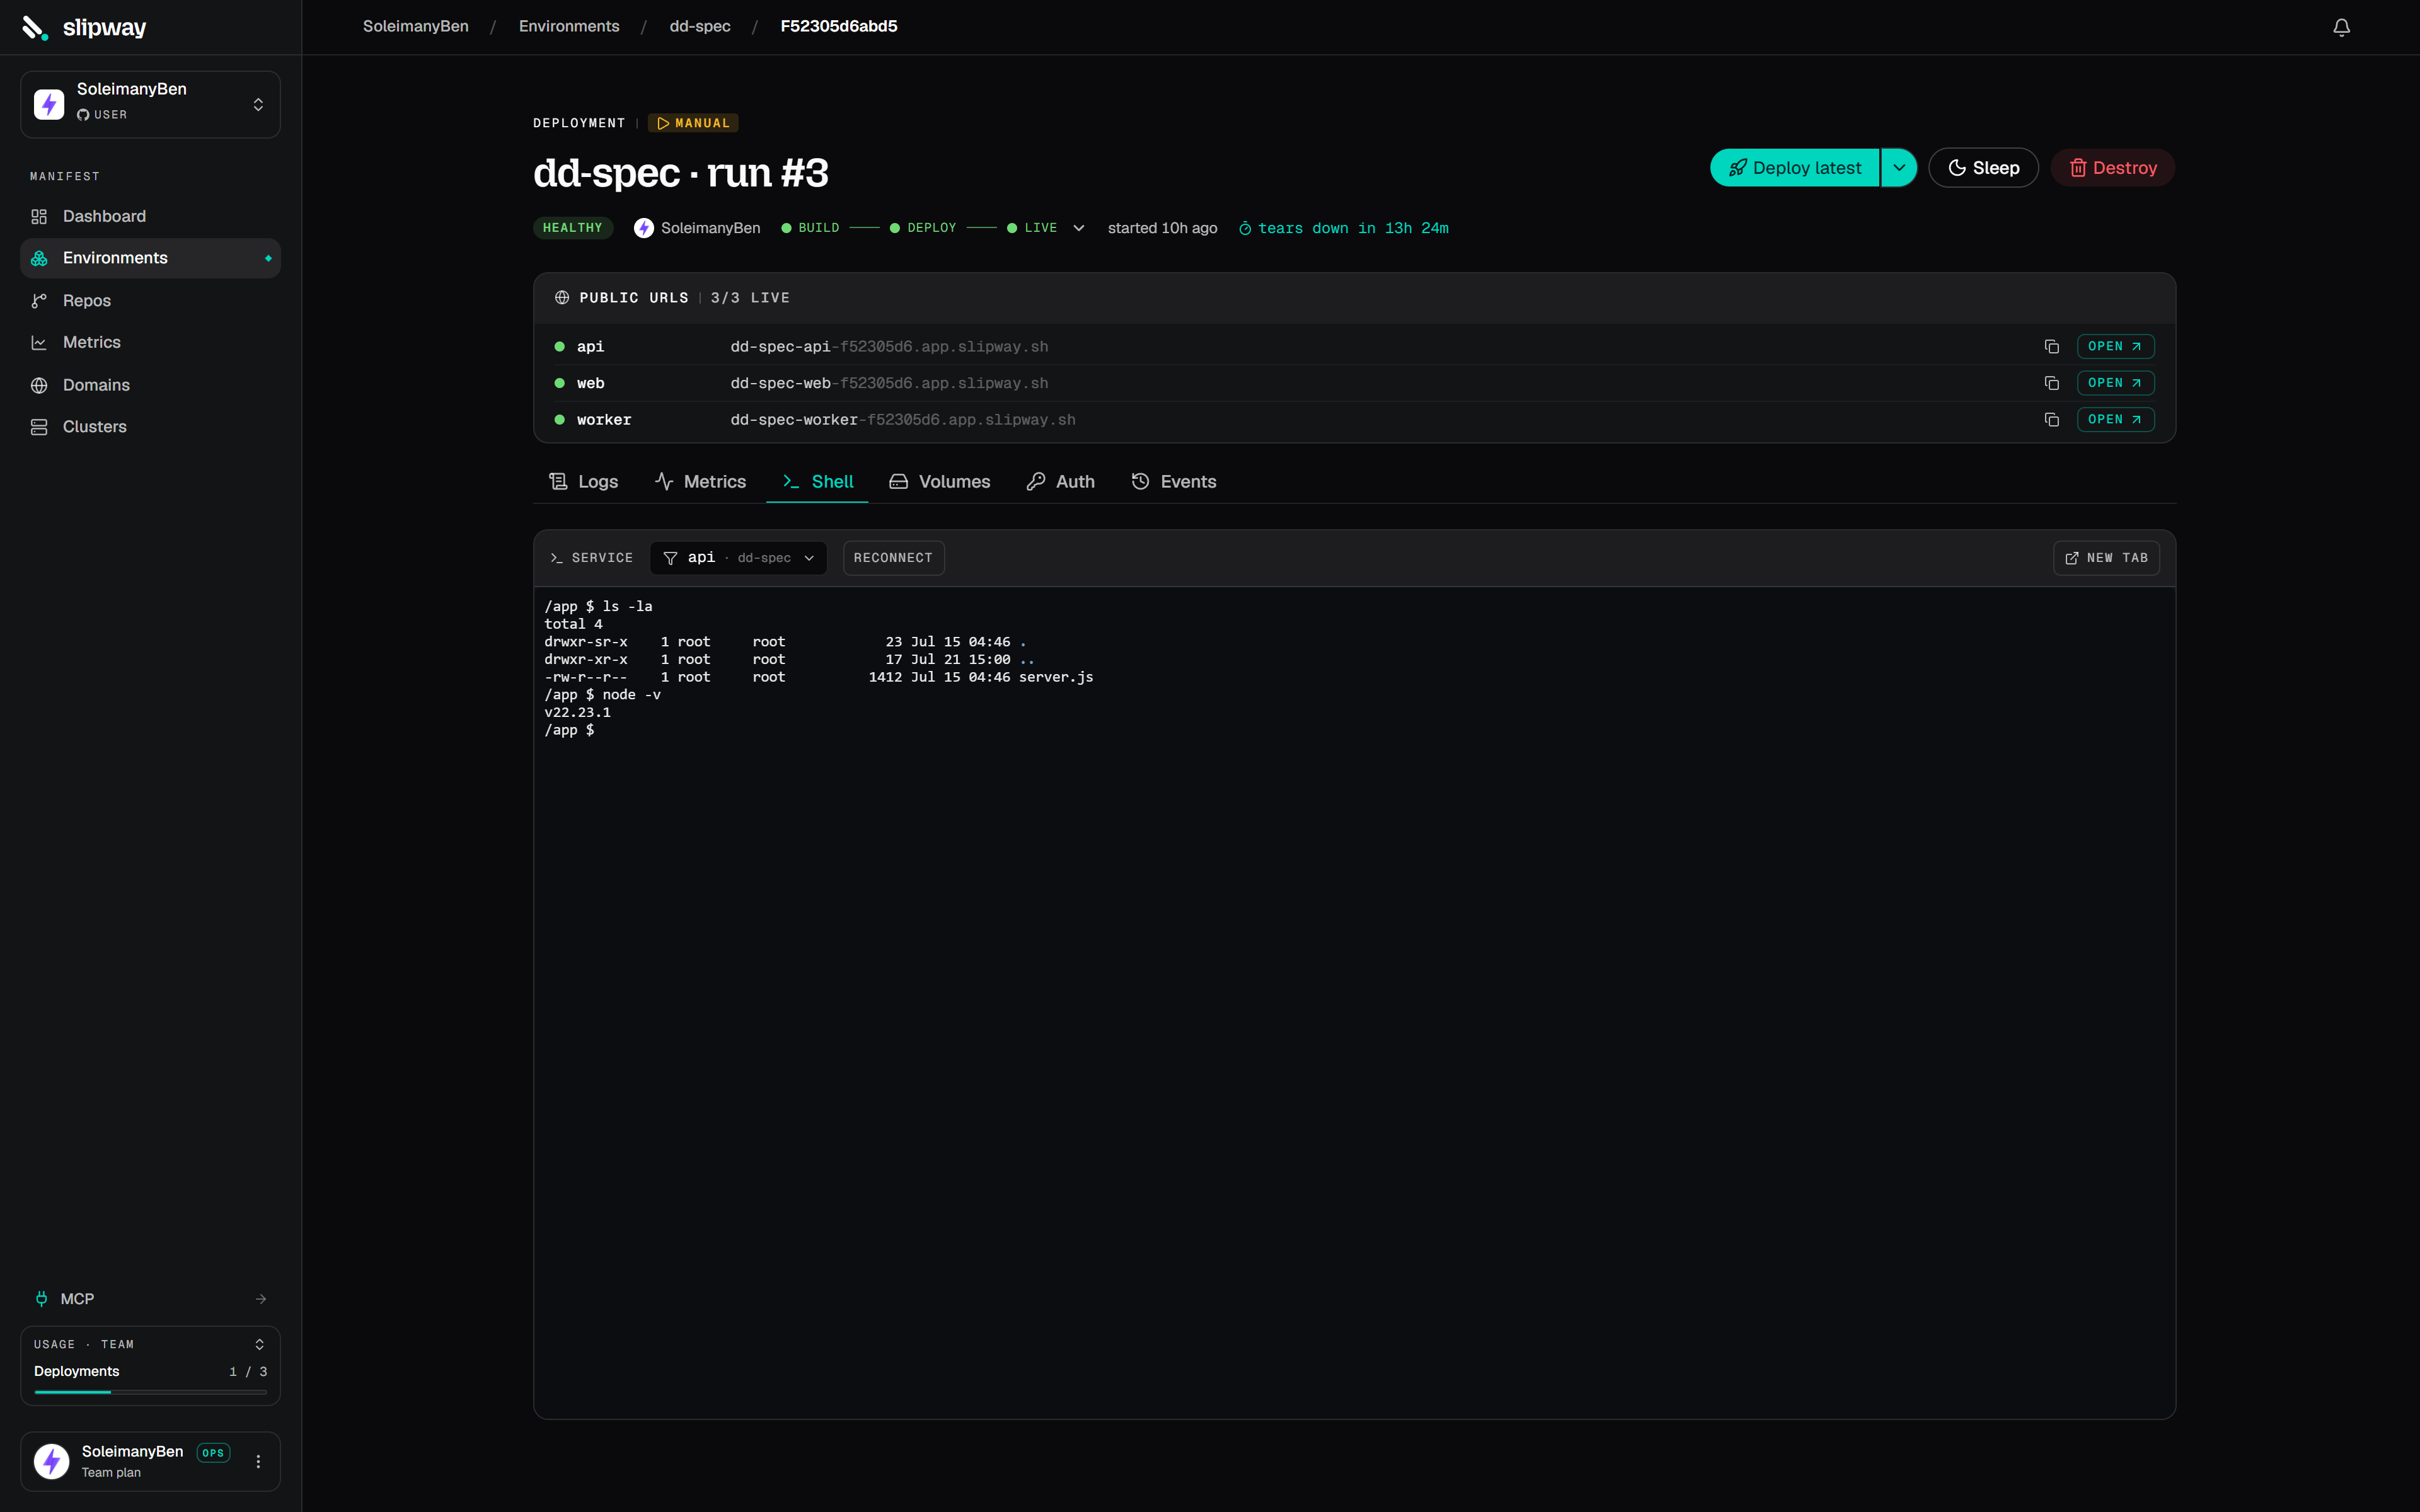
The Shell tab connects to your first service automatically.
top, vim), colour, and resize all work.
A few things to know:
- Healthy only. There’s no running container to attach to before
healthy, and the instance is gone after a terminal state. - Which shell. Slipway uses the first of
/bin/sh,/bin/bash,/bin/ashthat exists in your image. Fully distroless images have no shell to attach to. - Ephemeral. Anything you install lives only in that container’s writable layer and is gone on the next restart.
- Permissions. Developer role or higher. Every session is recorded in the org activity log with the user, service, and deployment.