> ## Documentation Index
> Fetch the complete documentation index at: https://docs.slipway.sh/llms.txt
> Use this file to discover all available pages before exploring further.
# Watching a deployment
> Live logs and an interactive shell, right on the deployment page.
The deployment page tracks the lifecycle with a phase ladder up top (`build → deploy → live`) and lists the public URLs once they're up. Below that, the **Logs** and **Shell** tabs let you watch and debug — with **Metrics** and **Volumes** alongside for resource usage and snapshots.
## Logs
Every line your containers write to stdout/stderr is captured and kept for **30 days**. Slipway narrates its own deploy steps into the same stream, so the log tells the whole story — not just your app's output.
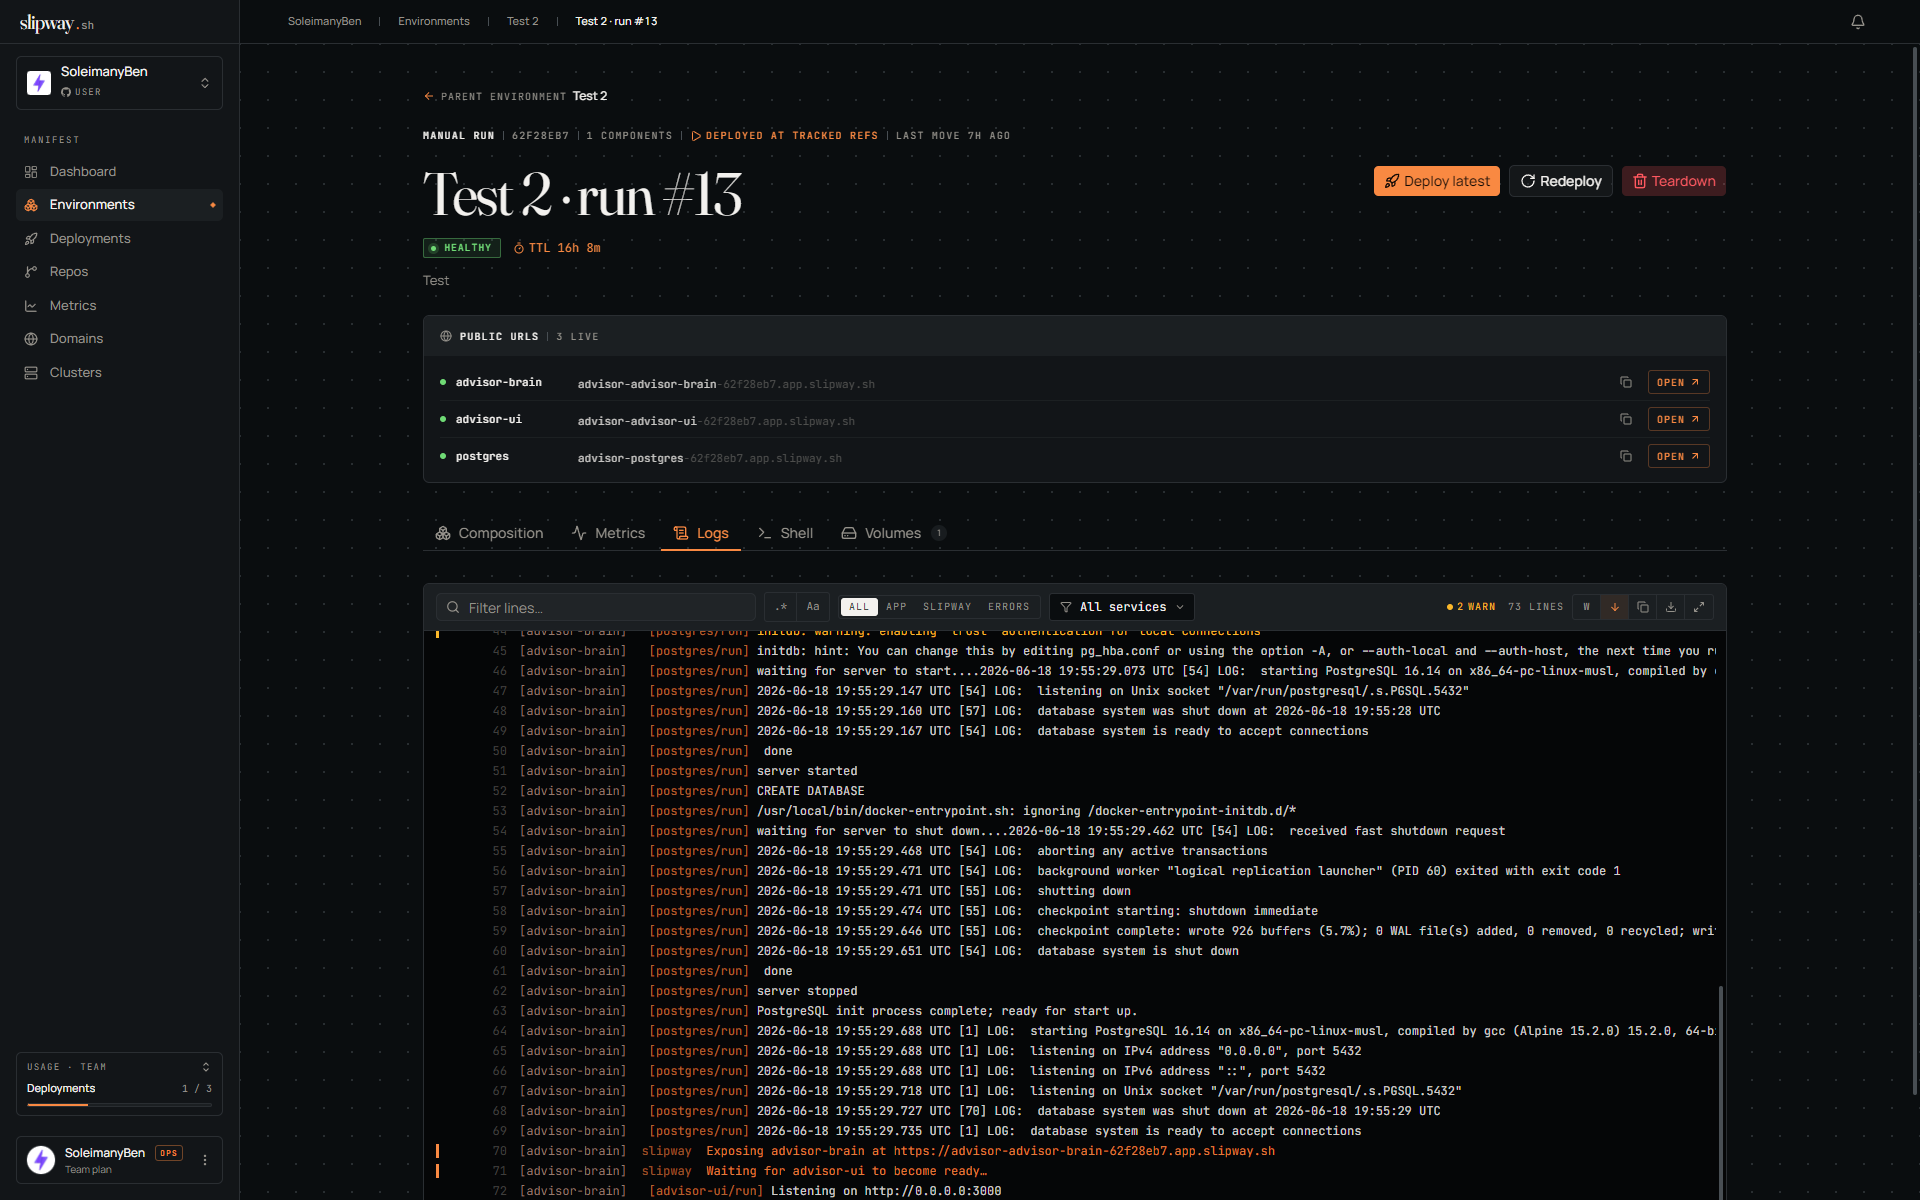 Three kinds of line are interleaved, each tagged by source:
* **Slipway steps** — the platform's narration: fetching the spec, resolving secrets, building, deploying, waiting for readiness, and the final verdict.
* **Build output** — clone and image-build output, tagged by service.
* **Container output** — your services' stdout/stderr once running, tagged by service.
The control strip lets you filter by **phase** so you can jump straight to the stage you care about:
* **Build** — image builds: clone and buildctl output plus the `Building…` / `Built…` narration.
* **Deploy** — slipway bringing the workload up: resolving secrets, applying workloads, preparing volumes, waiting for readiness, and exposing URLs, along with the surfaced pod events (scheduling, pulling, probes).
* **Run** — your services' own stdout/stderr once they're running.
You can also narrow to a single service, and search with optional regex and case-sensitive toggles. Copy the visible lines or download the full buffer as a `.log` file. Open the tab mid-deploy and you get the last few minutes immediately. For the full catalog of lifecycle statuses and event kinds, see [Statuses & events](/reference/statuses).
## Shell
When a deployment is healthy, open the **Shell** tab to get an interactive shell straight into any of its containers — no `kubectl`, no kubeconfig.
Three kinds of line are interleaved, each tagged by source:
* **Slipway steps** — the platform's narration: fetching the spec, resolving secrets, building, deploying, waiting for readiness, and the final verdict.
* **Build output** — clone and image-build output, tagged by service.
* **Container output** — your services' stdout/stderr once running, tagged by service.
The control strip lets you filter by **phase** so you can jump straight to the stage you care about:
* **Build** — image builds: clone and buildctl output plus the `Building…` / `Built…` narration.
* **Deploy** — slipway bringing the workload up: resolving secrets, applying workloads, preparing volumes, waiting for readiness, and exposing URLs, along with the surfaced pod events (scheduling, pulling, probes).
* **Run** — your services' own stdout/stderr once they're running.
You can also narrow to a single service, and search with optional regex and case-sensitive toggles. Copy the visible lines or download the full buffer as a `.log` file. Open the tab mid-deploy and you get the last few minutes immediately. For the full catalog of lifecycle statuses and event kinds, see [Statuses & events](/reference/statuses).
## Shell
When a deployment is healthy, open the **Shell** tab to get an interactive shell straight into any of its containers — no `kubectl`, no kubeconfig.
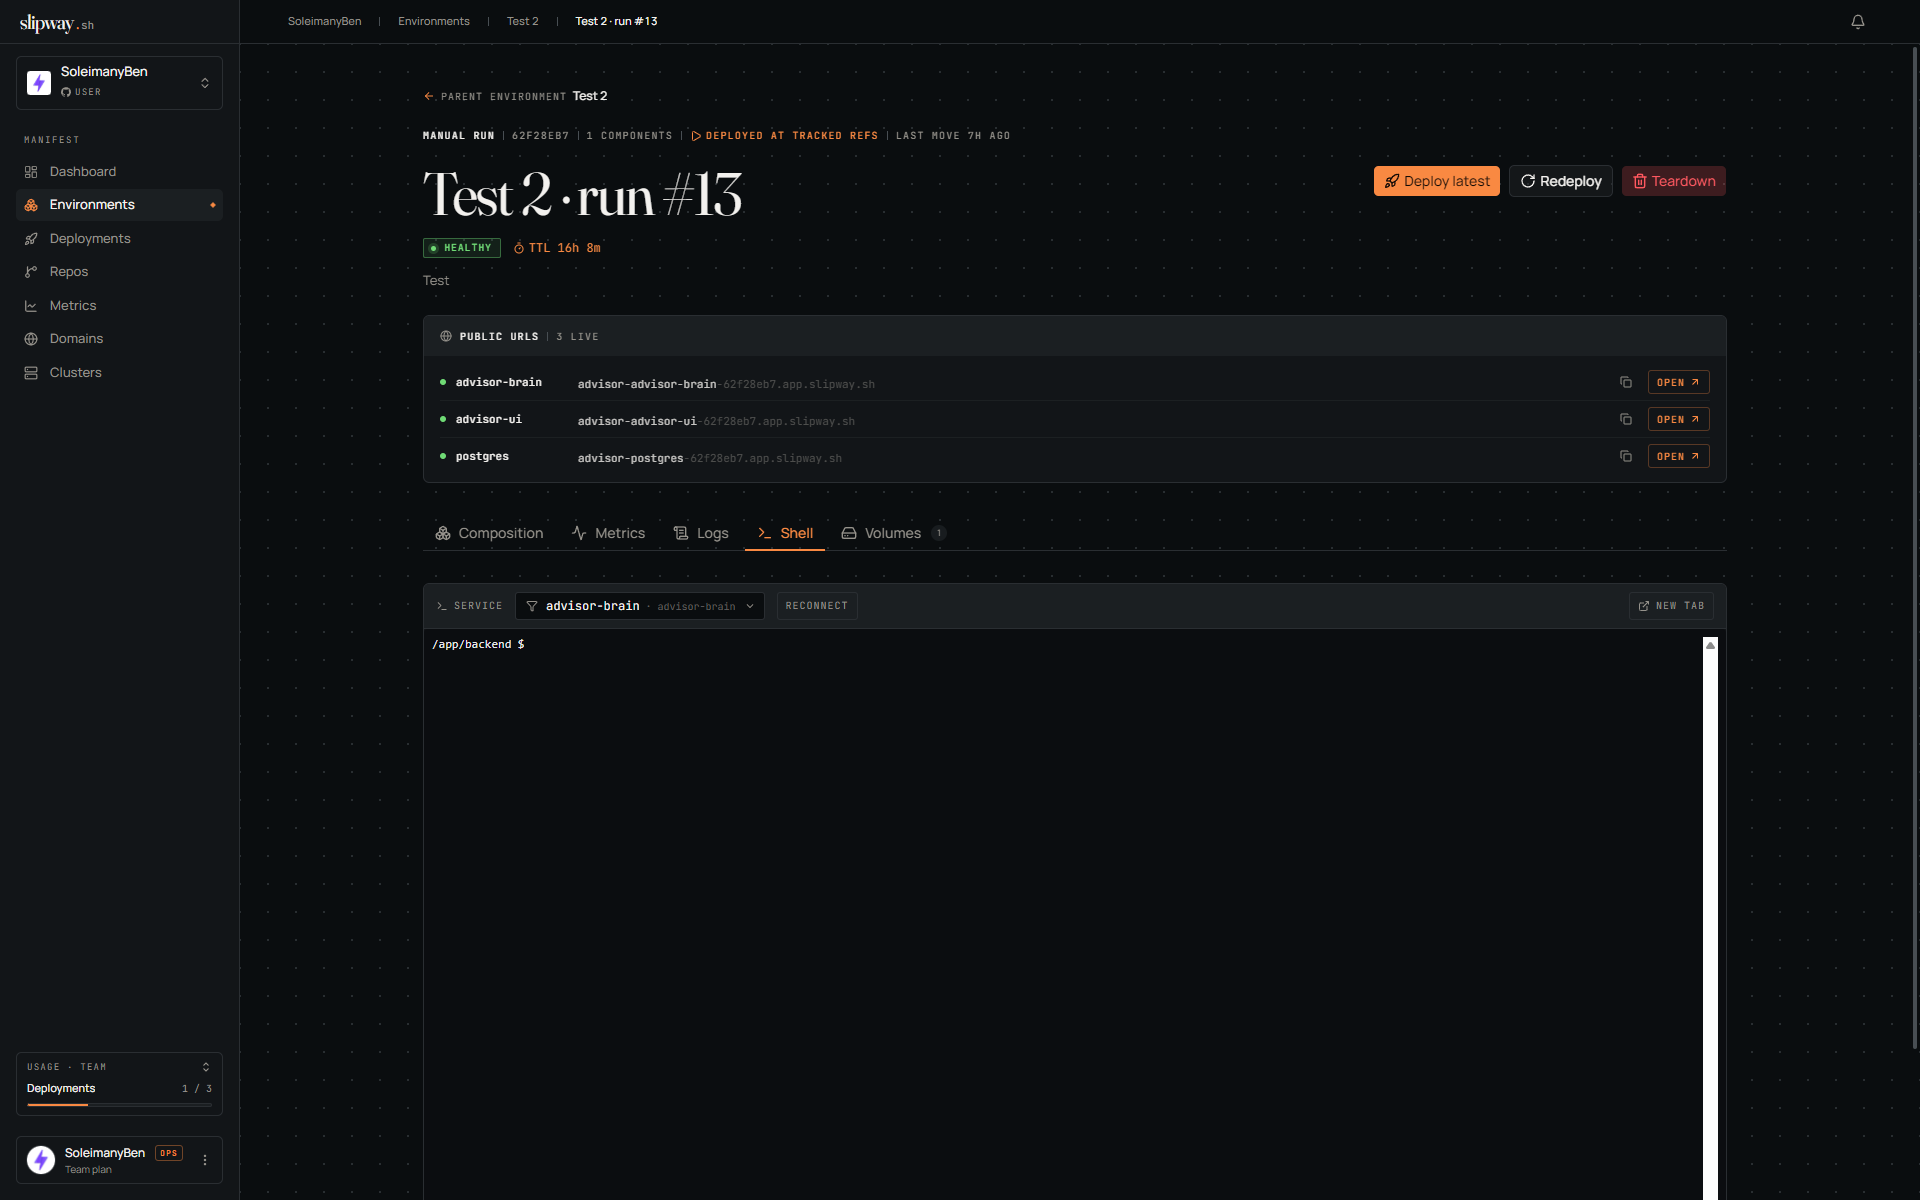 The **Service** dropdown switches which container you're attached to; **Reconnect** starts a fresh session on the same one. For a dedicated terminal window alongside your logs, click **New tab**. It's a real PTY — arrow keys, tab completion, full-screen TUIs (`top`, `vim`), colour, and resize all work.
A few things to know:
* **Healthy only.** There's no running container to attach to before `healthy`, and the instance is gone after a terminal state.
* **Which shell.** Slipway uses the first of `/bin/sh`, `/bin/bash`, `/bin/ash` that exists in your image. Fully distroless images have no shell to attach to.
* **Ephemeral.** Anything you install lives only in that container's writable layer and is gone on the next restart.
* **Permissions.** Developer role or higher. Every session is recorded in the org activity log with the user, service, and deployment.
The **Service** dropdown switches which container you're attached to; **Reconnect** starts a fresh session on the same one. For a dedicated terminal window alongside your logs, click **New tab**. It's a real PTY — arrow keys, tab completion, full-screen TUIs (`top`, `vim`), colour, and resize all work.
A few things to know:
* **Healthy only.** There's no running container to attach to before `healthy`, and the instance is gone after a terminal state.
* **Which shell.** Slipway uses the first of `/bin/sh`, `/bin/bash`, `/bin/ash` that exists in your image. Fully distroless images have no shell to attach to.
* **Ephemeral.** Anything you install lives only in that container's writable layer and is gone on the next restart.
* **Permissions.** Developer role or higher. Every session is recorded in the org activity log with the user, service, and deployment.